Debugging can be an especially powerful tool for learning programming. It is essentially the process of walking through your program in different orders and examining the contents of the computer's storage areas. We'll take a brief walk through a typical debug session using helloworld.exe.
We start our debugging by setting a break point. This is a line of code where the execution should pause until you decide to continue. From this point to can examine the contents of CPU registers or memory. Put your cursor on line 112 and click the Add Breakpoint tool button. Notice the red dot that appears next to the line to signal the breakpoint. (see figure 14)

Figure 14
Now start the debugger by clicking the debug toolbar icon (see gigure 15)

Figure 15
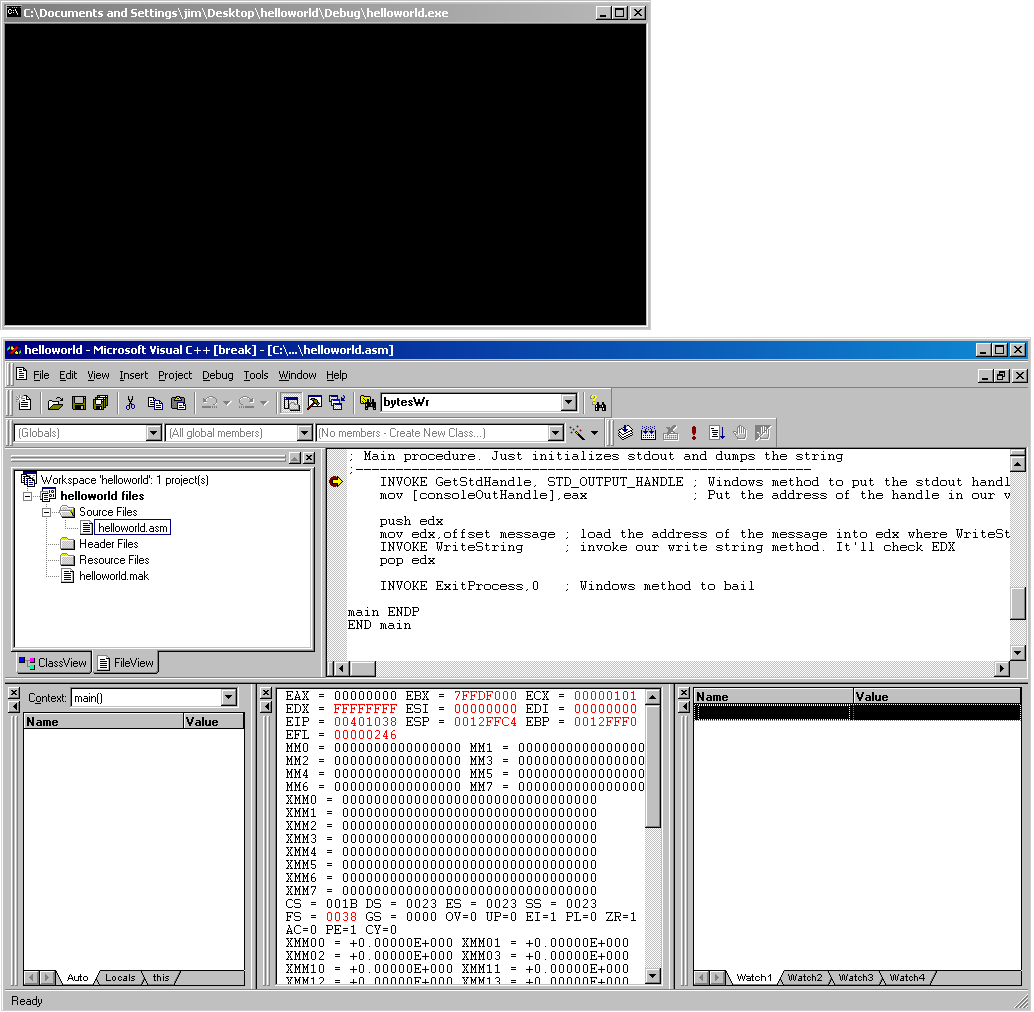
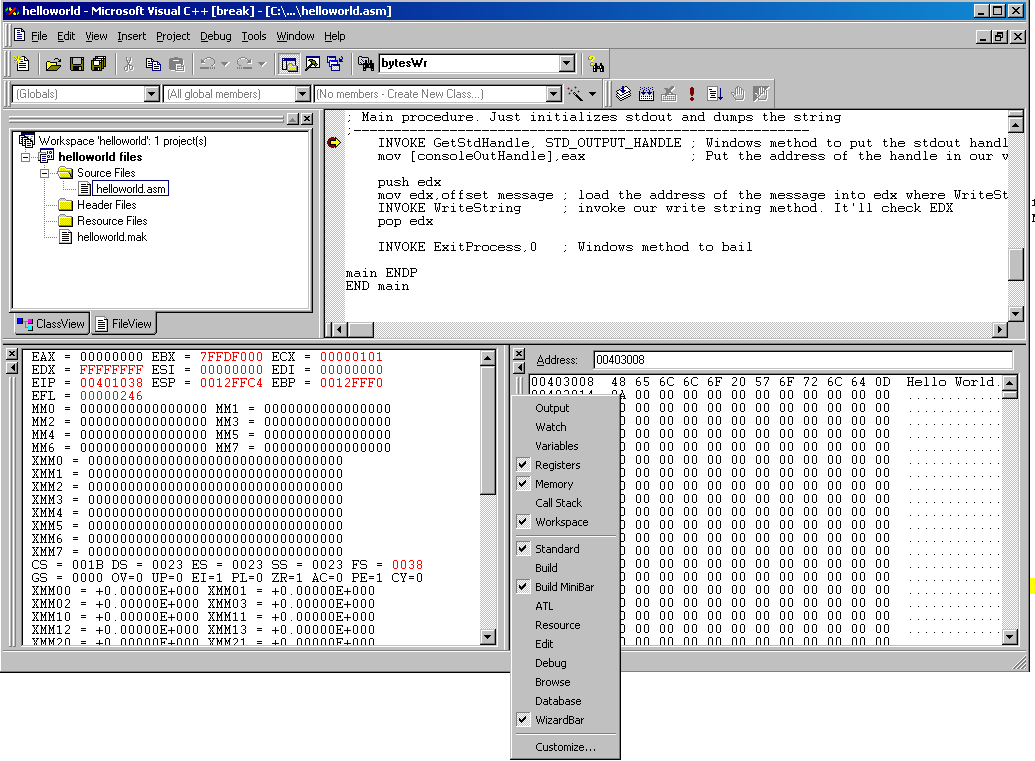
Let's take a moment to notice a couple of things. Once you start the debugger. A couple of new debug windows will appear (depending on your configuration) (see figure 16). This is a good view for C++, but isn't great for assembly. Right click a frame of one of the new windows and make it such that you have the "Registers" and "Memory" docklets visible (see figure 17).

Figure 16

Figure 17
You can use the "Step Over" button on the debug toolbar to execute the next line (see figure 18). Watch the registers panel when you do that. Continue to click that button until you get to line 121 where "procWriteString" is invoked. Look at the value of the EDX register in the registers window. Cut and paste it's value into the address box of the memory window. You'll see our message "Hello World" is stored at that memory address. This tells you that the value in EDX is the address of the our string variable (figure 19). Pretty handy huh?

Figure 18

Figure 19
Now, that you've seen the meat of debugging you can halt the debugger, let the program run to completion, or continues stepping to the end of the code. You should now understand how to use debugging to examine the contents of a running program.